Use the Mobile Debugger
Validate your SDK install and inspect the data your app sends to Appcues.
Table of Contents
The Mobile Debugger is a tool bundled with the Appcues SDK that runs inside your app. Once the SDK is installed on iOS, Android, or a cross-platform framework, use the debugger to:
- Validate the SDK is installed correctly and sending data to Appcues.
- Inspect the screen names and event names being sent to Appcues for Flow targeting.
- Inspect auto-properties the SDK collects, for audience segmentation and other Flow targeting needs.
- View the fonts available in your app for use in the mobile builder.
- Troubleshoot live Flows — for example, diagnosing why a step is missing.
- Check that push notifications are configured correctly.
Prerequisites
- The Appcues SDK is installed and initialized in the app. See Installing the Mobile SDK.
- To launch via a deep link, the SDK's custom URL scheme is configured in the app.
Launch the debugger
You can open the debugger inside your app in any of these ways:
- Scan the QR code on the Installation Settings page for each registered app in your Appcues account.
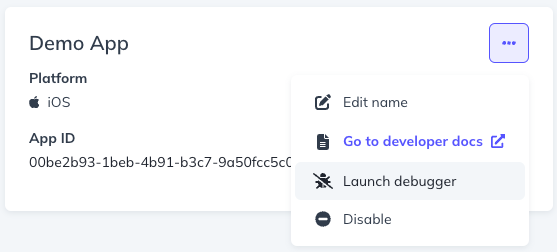
- Open the debugger URL on the device you want to test:
https://mobilebuilder.appcues.com/?type=debugger&appId=[AppID] - Call
appcues.debug()directly in your app code — from a button or menu inside the app. This isn't always feasible, and you don't want it visible to your app's end users. - Open a deep link to the Appcues SDK that launches the debugger:
appcues-{application_id}://sdk/debugger. Tapping this link on the device opens your app with the debugger on top. This requires the SDK to be installed with the Appcues URL scheme configured — refer mobile developers to the SDK installation docs.
Use the debugger
When the debugger launches, a small floating button with the Appcues logo appears on top of your app's content. Drag it to reposition it, or drag it to the bottom center of the screen to dismiss it.

Tap the button to open the expanded view. The Status section runs a checklist of diagnostics. A green checkmark means the check passed, a red ✗ flags a problem (with an error message), and "..." means the check needs an action from you:
- Device — the device model and OS version.
- Installed SDK — the SDK version, along with your Account ID and Application ID.
- Connected to Appcues — the SDK is communicating with Appcues.
- Appcues Deep Link — tap this row to check your deep link configuration.
- Push Notifications Configured — whether push is set up correctly. A red ✗ shows the error, for example "Error 0: Unexpected server error".
- Tracking Screens — whether screens are being tracked. If it shows "...", navigate to another screen in the app to test.
- User Identified — the identified user (shown as a user ID or email).
- Group Identified — the identified group, or "No Group Identified" if none.

When a Flow is displaying on the device, a row shows which Flow and step is on screen — for example, "Showing User Survey" with "Group 2 step 2".
The Info section holds reference details, such as Available Fonts (the fonts available in your app for use in the mobile builder), Plugins, and a Detailed Log of SDK activity.
The Recent events section lists recent analytics from the SDK — screen views, custom events, Flow and step events (such as Step Seen and Step Interaction), and errors (such as Experience Error), each with a timestamp. Tap an event to inspect its details, or use the filter icon to narrow the list. Tapping a screen event shows the screen name — the exact text to use when targeting a Flow to that screen.
When the debugger is minimized, browse your app and the current screen name appears in a small floating text bubble above the button, for quick reference. Any custom events your app tracks also appear there when minimized, or in Recent events when the debugger is expanded.
Troubleshoot live Flows and push
Beyond validating your install, the debugger helps you troubleshoot experiences on the device:
- Push notification configuration: the Push Notifications Configured status row shows whether push is set up correctly. A red ✗ with an error message (for example, "Error 0: Unexpected server error") means it isn't — resolve the error before relying on push.
- Missing or skipped steps: when a Flow is displaying, the "Showing [Flow] — Group X step Y" row tells you which step is on screen. Watch Recent events for Step Seen and Step Interaction to see how far a user progressed, and for Experience Error, which flags a problem rendering the experience. If a step never appears, check whether its Step Seen event fires or an Experience Error is logged.
Confirm it worked
- The Status section shows green checkmarks for Installed SDK, Connected to Appcues, and User Identified.
- As you navigate the app, screen names appear in the floating bubble and in Recent events.
If screens or events aren't tracked
Screen and event tracking depend on how your mobile developer installed and configured the SDK. If screens or events aren't appearing as expected, ask your developer to consult the SDK installation documentation.
If the debugger won't launch
- For the deep-link method, confirm the SDK's custom URL scheme is configured in the app.
- Confirm the SDK is installed and initialized — try the QR code or debugger URL method instead.
Still stuck?
Collect the following and contact support:
- The platform (iOS, Android, or which cross-platform framework) and OS version.
- Which launch method you tried.
- A screenshot of the debugger's expanded view and any error logs.