Analyze Flow performance
Track Flow performance, engagement, and drop-off — using the analytics page, step breakdown, issues reporting, survey responses, and CSV exports.
Table of Contents
Analytics data in Appcues typically appears within 5–15 minutes, though this can vary based on system load and data volume.
Flows 2.0 (Beta): Flows 2.0 Experiences use this same analytics page, but report on a different event model. Where 2.0 works differently from legacy Flows, it's flagged below.
Open the Flow analytics page
Go to Experiences > Flows in Studio, click on a Flow, then select the Analytics tab. You can adjust the date range and apply a segment filter to narrow the data. The publish history is also visible so you can correlate changes with performance shifts.
The chart
The chart shows Flow events over time, plotted by daily unique users. Hover over data points to see views, completions, and other metrics for that day.
If a user sees a Flow once per day for three consecutive days, each day counts as one unique view.

Version markers on the chart indicate when a change was published and seen by a user. Use these to spot the impact of content or targeting updates.
The scoreboard
The scoreboard displays four key metrics for the selected date range:
- Users Seen — total unique users who saw the Flow, plus total times the Flow was shown. If the Flow is set to Show once, these numbers match. If set to Show every time, total events will be higher than unique users.
-
Flow Completion — the completion rate, calculated as unique users who completed the Flow (triggered a
flow_completedevent) divided by unique users who started it (triggered aflow_startedevent). - Issues — the number of issues encountered (for example, elements not found). See Issues reporting below.
- Goals — if a goal is set for this Flow, the goal completion data appears here. Click to go to the Goals page.

Step breakdown
The step breakdown shows engagement at the individual step level:
- Shown — how many users saw the step
- Completed — how many users completed the step
- Issues — how many users hit an issue on the step
View this as a funnel to identify where users drop off and where to optimize.
The step breakdown always shows data for the most recently published step structure. If you added, removed, or reordered steps after the Flow was published, the funnel may show discrepancies between older and newer data.

How step completion is counted in analytics
Flows 2.0: "Started" and "completed" are defined at the experience level — there's no step-group event selection, and the definition no longer changes based on whether a step is a Modal or a Tooltip.
| Pattern | Completed when… |
|---|---|
| Modals / Slideouts | The final step in the group is dismissed via a "Next step" button, a "Go to URL" button with "Mark flow in progress as complete" selected, "Skip to Next Group" (on the last group), "Dismiss Flow" with "Mark flow in progress as complete" selected, or "Trigger Appcues Flow." Not completed if the user clicks the X (skippable) button. |
| Tooltips | The last Tooltip in the group is closed via a "Next step" button or any of the same custom button actions listed above. If no button is present, clicking the target element advances and completes the step. Not completed via the skip link or X button. |
| Hotspots | The last remaining Hotspot in the group is expanded (clicked). It does not need to be dismissed or collapsed — expanding the beacon is enough. Same custom button actions also apply. |
Hotspot scoreboard vs. step breakdown difference
Legacy Flows only. Flows 2.0 doesn't use Hotspots, so a 2.0 Experience has no hotspot scoreboard.
The scoreboard counts users who were shown the Hotspot beacon. The step breakdown "Shown" column counts users who clicked the beacon and saw the Hotspot content. The "Completed" column counts users who expanded the beacon, saw the content, and then clicked elsewhere to close it. This is why the scoreboard may show a higher user count than the step breakdown for Hotspots.
Issues reporting
The issues table shows the 25 most recent issues users encountered — for example, an element not found for a Tooltip or Hotspot. Each row shows the issue type, the reason, the CSS selector involved, and when the issue was last seen.
Common causes:
- Element not available for all users — some users don't have the element on their page (for example, a feature behind a permission gate).
- Selector changed after an app update — the CSS selector Appcues saved no longer matches the element.
- Dynamic selector — the selector is generated at runtime and changes on each page load.
Click the Builder link on any issue to open the Flow and fix the selector. For a full list of issues, export the Full CSV.
For details, see Issues reporting.

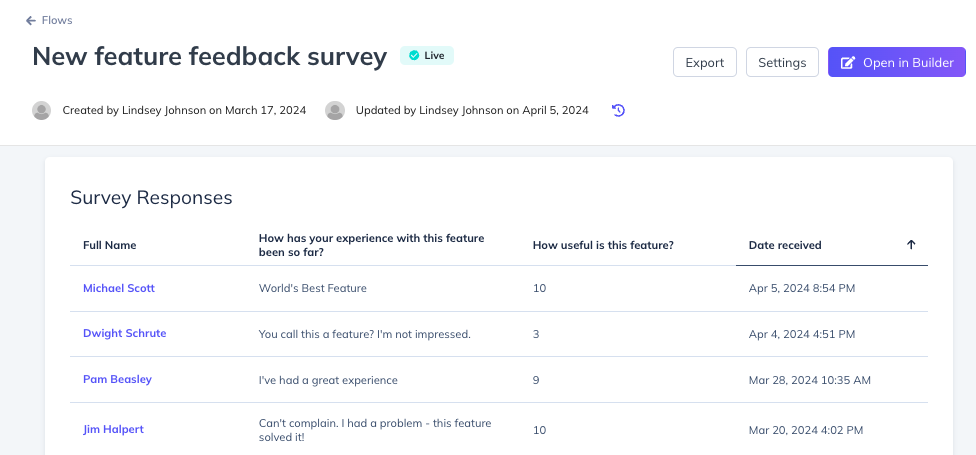
Survey responses
If the Flow contains a survey or form, submitted responses appear in this section. See View form and survey responses for details on filtering and exporting response data.
Most recent users
The 10 most recent users who saw the Flow are listed with the date and time they viewed it. Click any user to open their full user profile with all attributes and experience history.
Events Explorer
Flows 2.0: 2.0 Experiences appear in the Events Explorer under the Flow Events category and get their own single-metric pages, alongside legacy Flows.
For additional analysis, use the Events Explorer:
- Filter by Flow Events in the Event Source dropdown.
- Select a Flow to see data broken down by three events: Flow Shown, Flow Completed, and Flow Issues.
- Click any event to see a chart, total and unique event counts, and a table of all triggered events. Use the table to search for a specific user.
- You can adjust the date range and export a CSV for a single event type from this view.

Export Flow data
Export from the analytics page
- On the Flow analytics page, set the date range.
- Click Export CSV and choose a format:
| Format | Contains |
|---|---|
| Basic | Default user properties (User ID, browser, language) + raw Flow events (started, completed, skipped, step interactions) |
| Full | Everything in Basic + all custom user properties + advanced events (Flow Attempted, etc.) for debugging |
| Survey | One row per user with latest form/survey responses only — no behavioral events |
The CSV arrives via email in a .zip file. Extract it to get the .csv.

Export from Events Explorer
- In Events Explorer, select the specific event you want to export.
- Set the date range.
- Click the export button.
The CSV includes only the selected event type (for example, flow_completed).
For details on CSV structure and fields, see Export Flow analytics data.
Flow events reference
Flows 2.0 uses a different event model. 2.0 Experiences emit
appcues:v2:experience_*andappcues:v2:step_*events instead of the legacyflow_*/step_*events listed below — for example,flow_started→appcues:v2:experience_started. See Build Flows 2.0 Experiences for the full mapping.
These are the event names you see in CSV exports and integrations. They can also be exported via the Public API.
Flow-level events
| Event name | Description |
|---|---|
flow_started |
The first step of the Flow is displayed on screen |
flow_completed |
The user completes the last step of the Flow |
flow_skipped |
The user dismisses the Flow (clicks X, "Hide these tips," or clicks outside a skippable Modal) |
flow_aborted |
A fatal error prevents the Flow from starting or completing |
flow_error |
A fatal error prevents starting the Flow (usually caused by a step-level error) |
Step-level events
| Event name | Description |
|---|---|
step_started |
A step group is displayed on the page |
step_completed |
The user completes a step group (clicks "Next step," clicks the target element, or expands the last Hotspot) |
step_skipped |
The user skips a step group (clicks X, dismiss link, or a custom skip button) |
step_interacted |
The user interacts with a step (clicks a button, submits a form, expands a Hotspot) |
Step-child events
| Event name | Description |
|---|---|
step_child_activated |
An individual step within a group is shown |
step_child_deactivated |
An individual step is completed and deactivated |
step_child_error |
The element a Tooltip or Hotspot is anchored to could not be found — appears in Issues reporting |
step_child_recovered |
A previously errored step finds its target element and displays |
Form events
| Event name | Description |
|---|---|
form_submitted |
A form within a step is submitted |
form_field_submitted |
An individual form field response is recorded |
For the full technical specification of event properties and payloads, see Flow Events Reference (Developer).
If the data doesn't look right
- Zero views — confirm the Flow is published and that your date range covers the period when it was live. Open the Appcues debugger to verify Appcues is loading on the page.
- Completion rate seems off — completion is calculated at the user level (unique completers / unique starters). If many users skip the Flow or drop off mid-step, the rate will be low. Check the step breakdown funnel to identify where users are leaving.
- Step breakdown numbers don't match the scoreboard — this is expected for Hotspots. The scoreboard counts beacon impressions; the step breakdown counts beacon expansions. See Hotspot scoreboard vs. step breakdown difference above.
- Step funnel looks wrong after editing — the step breakdown shows the most recently published structure. If you reordered or added steps, older data may not align. Narrow the date range to after the latest publish date for an accurate funnel.
- Test mode views appearing in analytics — they shouldn't. Test mode views are excluded from analytics. If you're seeing unexpected data, check whether the Flow was also published live during the same period.
-
No survey responses — survey data only appears when users submit a form. If the form step has a low completion rate, check whether users are dropping off before reaching it. Make sure the submit button is set to
next.
If the issue persists, collect the Flow ID, the date range, and a screenshot of the analytics page, then contact support.